The following is a guest post by Associate Director, Associate Director of Web Communications at Wayne State University. Associate Directorwrites on the Universities Web Communications Blog and is the mastermind behind EDU Checkup video blog which strives to “turn Web Workers into Web Rockstars”! Besides connecting on his personal blog, you can also connect with him through Twitter or LinkedIn. This is the tenth and final post in the .eduGuru Blogger(s) Search Contest.
Analytics are the cornerstone of benchmarking, with good analytics comes good design/information decisions. Google Analytics has become the de facto standard in analytics reporting, even Founder lives and breaths it . Idealy keeping all your stats in one place allows you to search and compare everything, getting a view of the whole picture and ultimately making better decisions.
The Problem
Google Analytics is great for regular HTML pages because it uses javascript to track the page loads. But what about the pesky embedded flash on your page? Whether its there as an essential addition to your site or because the boss wants the homepage to “have movement” and “look flashy”. How can you tell if it is effective? Either for building a case for more interactivity or to prove your boss wrong when they say “more movement will attract more visitors”.
The Solution
You can track clicks and interactivity of flash with Google Analytics, no need to dig through server access logs to figure out how many people are clicking through your flash, although it would be fun but you have better things to do. Google has put together an , but I wanted to share our experience with a real life example
The Technique
Make sure you have the newest tracking code on your HTML page.
<script type="text/javascript"></script>
<script type="text/javascript"></script>
As long as you have the above Google Analytics script someplace that loads before the flash you can easily track “fake” page loads in flash using the getURL() function.
on (release) {
  // Track a URL that does not exist
  getURL("javascript:pageTracker._trackPageview('/folder/file.html');");
}
Real Life Example
On the Wayne State University homepage we have a flash piece that highlights success stories in five different categories. The user interaction involves the steps in the video below and we are always looking for the optimal user paths to increase views and click throughs from the “impact area” as we call it.
The Results
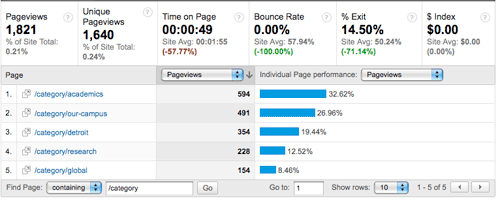
Inside Google Analytics you can simply go to your Content Overview and search for the dynamic URL’s you created in the flash. Below is the search for “/category” which shows us the number of categories visited.

From this we determined Academics is the most popular category. We initially thought people would just click down the list to see what is new but it turns out they pick and choose what categories they want to see, the popularity order does not match the order on screen.
Here is the graph of our category clicks since we installed the script.

Because of a build issue with the homepage the tracking code was removed for few days for most people so our results do have a few days with lower results.
Article Views and Click Through Rates
Once inside a category the most recent story loads, below a chart which shows a specific article views (Dark Blue Top Line) compared to its click through rate (Light Blue Bottom Line). As you can see was not a very popular article, getting only 30 views and 16 clicks at the most.

What this does is give us a baseline ratio for click throughs per view: (41 clicks / 146 views) = 28% click through rate which is a pretty good for most promotions. But when you compare that to our site visitors we only get a (146 views / 261,827 Unique Views) = 0.055% view rate.
Take Away
Without being able to track within the flash we would not have known how bad the conversion rate was. We now have the ammo to bring to the homepage committee and tweak the flash interface. Web pages are getting more complex and for each additional layer of interactivity the less Google Analytics will show since the page doesn’t reload. Getting all these statistics in one location gives a true overview of your users and their interaction.
Another fantastic post! Very useful for where we are right now at our university. We’re using an external vendor to track a flash object they created, and this is the way we’d like to consider going.
Thanks again for the ‘real-life’ example.
Great post Nick! Seeing the example and how you’re using the stats to improve the homepage at Wayne State is really helpful. This will be very useful at our college.
Google is investing really good in Flash. First better search and indexing using Adobe’s new technology for search engines, then adSense for Flash games and content, and now we will have analytics.
Google is the most innovative search engine, it frequently comes up with new and exciting features. Flash tracking system in Google Analytics is fair enough to analyze how these Flash presentations are performing. Some times it becomes very difficult to track performance of important things in the web, thanks to Google.
Thanks a lot Associate Directorfor writing about Flash Tracking System in Google Analytics.
That is great information. Im glad that I can relate to this sorta stuff. I know if you have any cell phone tracking software problems you can just use this Cell Phone Tracker software